Next: Building subjected to an Up: EXAMPLES Previous: Excavation in sand
In this example, an NATM tunnel excavated in stiff clay is simulated. The clay is simulated with London clay parameters (Tab. 4.3 for parameters of the basic model; Tab 4.5. for the intergranular strain parameters), with the initial value of void ratio equal to 0.7.
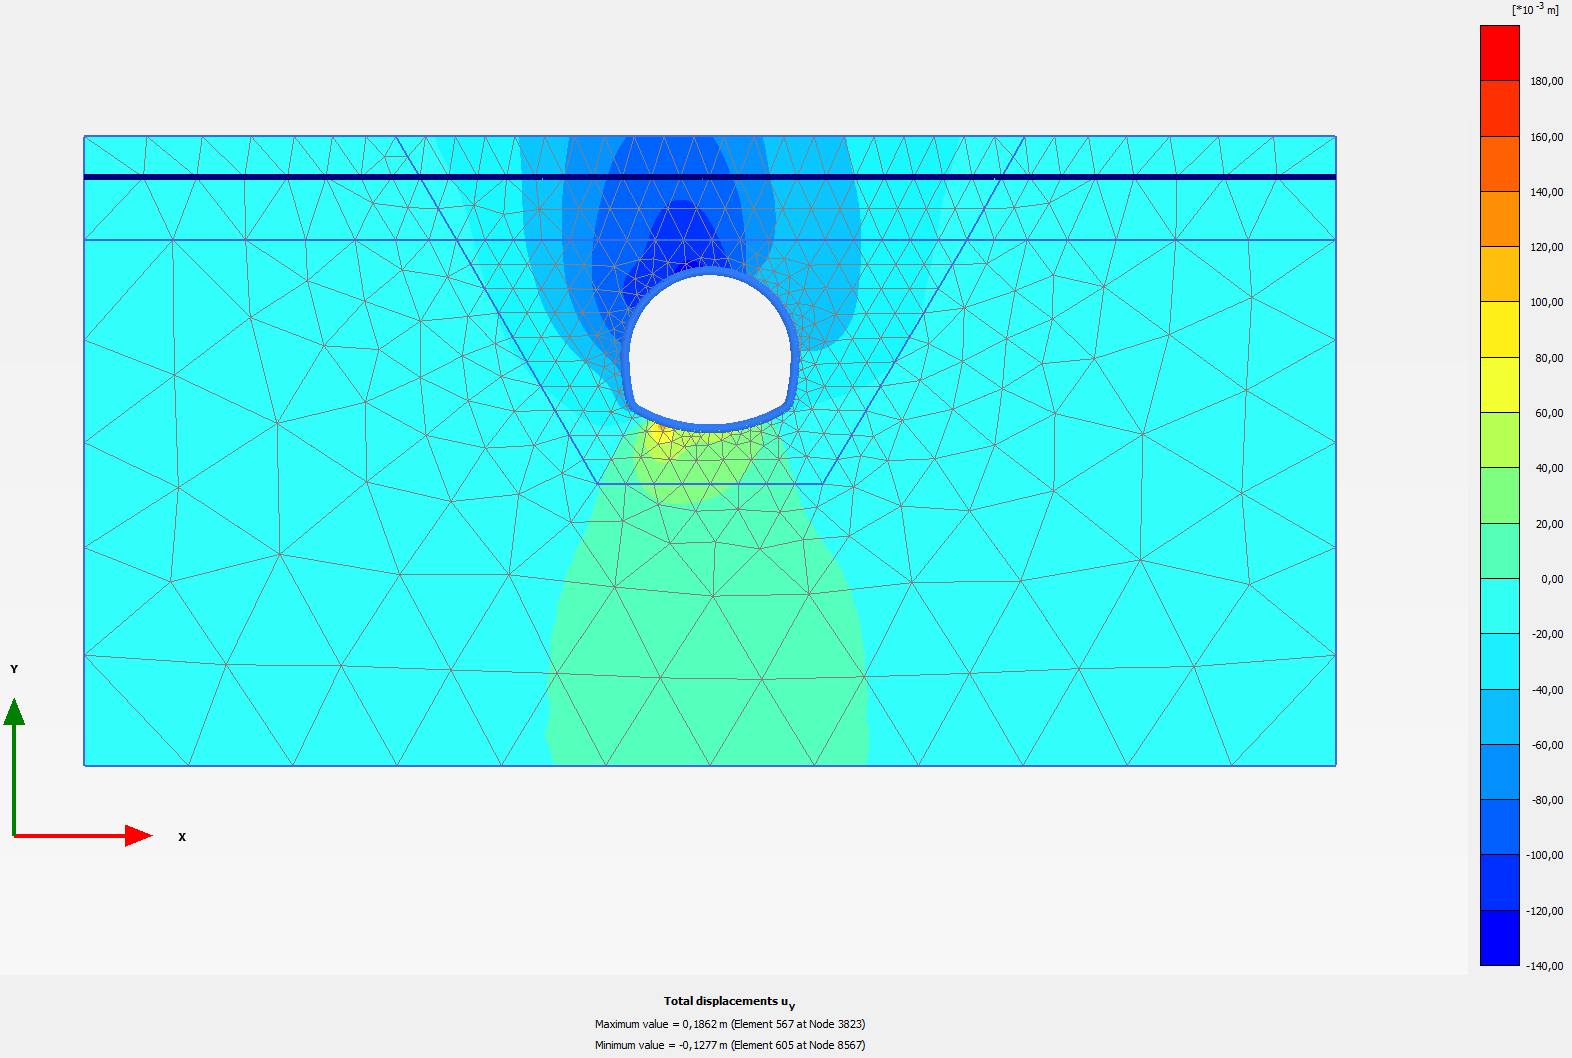
Figure 5.4 shows the displacement field predicted by the anisotropic stiffness model with
![]() , whereas 5.5
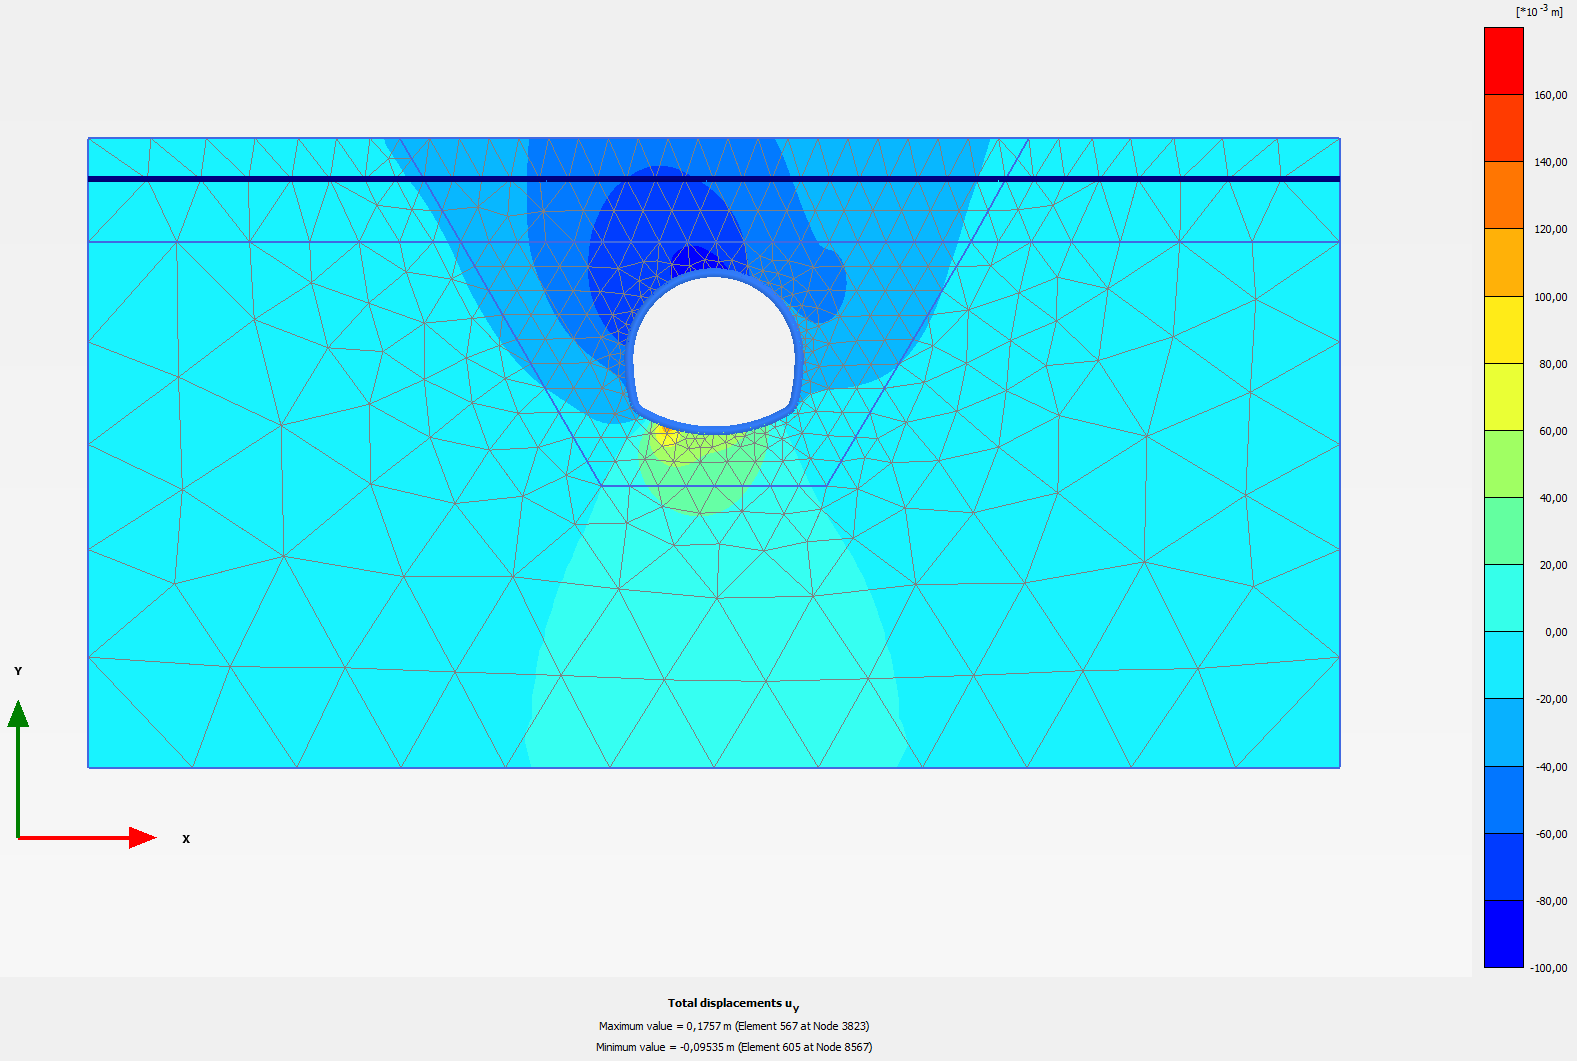
shows the displacement field predicted by the model with
, whereas 5.5
shows the displacement field predicted by the model with
![]() .
Clearly, the anisotropic model predicts narrower and deeper surrface settlement trough, which agrees better with monitored data.
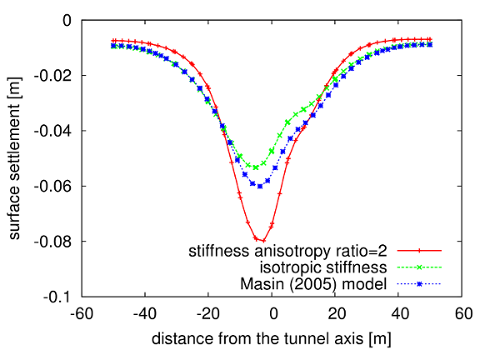
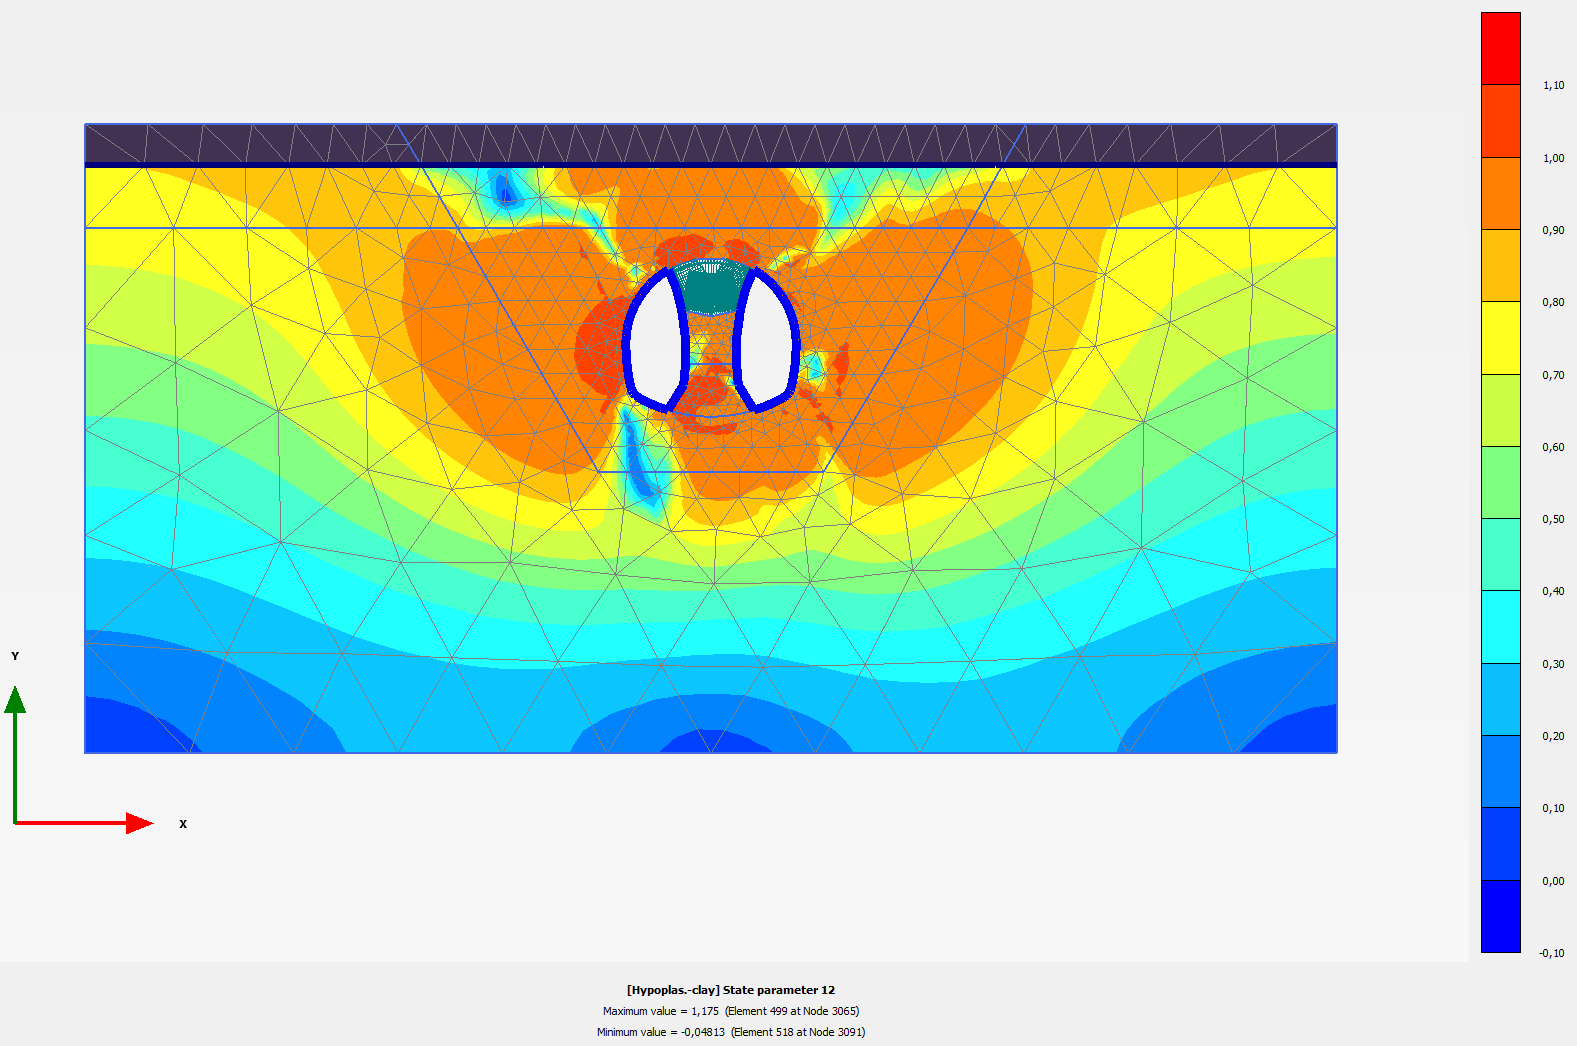
This is also clear from the settlement trough shown in Fig. 5.6. There, also predictions by the Mašín (2005) model [3] are included, which are close to the predictions by the isotropic model. Fig. 5.7 shows the normalised length of the intergranular strain tensor. The normalised length of the intergranular strain tensor in Fig. 5.7 demonstrates how the small-strain stiffness is activated
in different parts of the modelled geometry.
.
Clearly, the anisotropic model predicts narrower and deeper surrface settlement trough, which agrees better with monitored data.
This is also clear from the settlement trough shown in Fig. 5.6. There, also predictions by the Mašín (2005) model [3] are included, which are close to the predictions by the isotropic model. Fig. 5.7 shows the normalised length of the intergranular strain tensor. The normalised length of the intergranular strain tensor in Fig. 5.7 demonstrates how the small-strain stiffness is activated
in different parts of the modelled geometry.
David Masin 2017-09-12