

Analysis of watercourses on Aretin's map of the Bohemian Kingdom from 1619
Ing. Miroslav Čábelka, doc. Ing. Tomáš Bayer, Ph.D.
Aretin’s Map of the Bohemian Kingdom
Aretin's map of Bohemia from 1619 is the third oldest map of the Bohemia territory, with four known editions (1619, 1632, 1665, and before 1747). The first two editions are assigned to Paulus Aretin from Ehrenfeld. The third edition of Aretin's map is assigned to Daniel Wussin, and the fourth (and undated) edition is assigned to his son Kaspar Wussin. The famous Aretin family of engravers, publishers, and booksellers was established in the 17th century by Daniel Wussin.
Research goal
The research was focused on complex content and basic cartometric analysis of watercourses on Aretin's map of Bohemia from 1619 and its next editions. The aim was to find discrepancies in the depiction of watercourses and to identify unnamed rivers and water areas. The subject of the analyses were 4 copies of Aretin's map from the years 1619, 1632, 1665 and before 1747, which are part of the Map Collection of the Faculty of Science of Charles University and the National Archives in Prague.
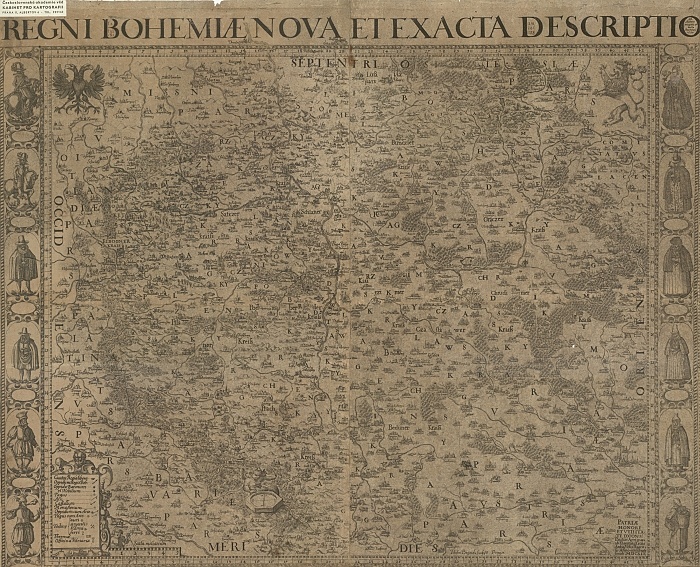
Fig. 1: Aretin's map of Bohemia, 2nd edition of 1632. Source: Map Collection of the Faculty of Science, Charles University.
The map is entitled "Regni Bohemiae Nova et Exacta Descriptio" (New and Exact Description of the Bohemian Kingdom); see Fig. 1. The rectangular map frame oriented to the north has dimensions of 574 x 766 mm, its approximate scale is 1:504,000 (Kuchař, 1936). A detailed explanation of the map symbols was also presented. The settlements depicted by a circle with a dot, emphasized by a silhouetted mask, containing 1157 items, are differentiated into the following categories: free royal towns, towns of the Bohemian king, manorial towns, and villages. Moreover, different map symbols were used to depict fortresses, castles, chateaux, and monasteries.
The map also shows relief, vegetation, and water supplies, as well as map labels. The terrain is represented by the hill method with shading; see Fig. 2.
Semiotic analysis and description of watercourses
On Aretin's map of Bohemia, watercourses are depicted using line symbols, the size of which corresponds to the dominance of the river. The space between the riverside lines is longitudinally hatched. The water areas are visualized using the area symbols, with the boundaries (simple contour) and the interior parts (fill combined with hatching and dots); see Tab. 1.
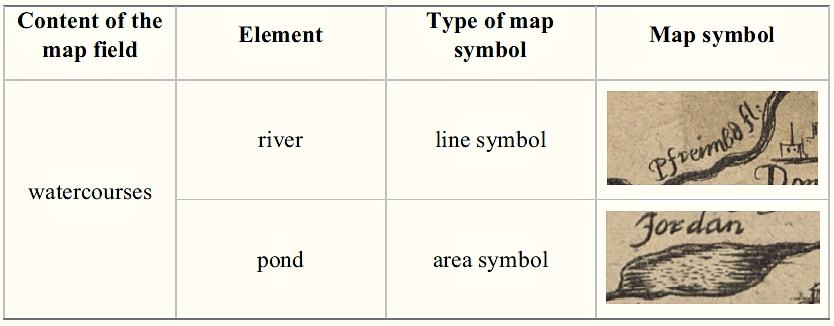
Tab. 1: Map symbols of Aretin's map of Bohemia. Source: Map Collection of the Faculty of Science, Charles University.
Regarding area symbols depicting ponds, their edges are highlighted. Because the fourth edition of the map has been overprinted, the linear and areal water features are more intense and darker. See Jordan Pond on the fourth edition map in Fig. 2.
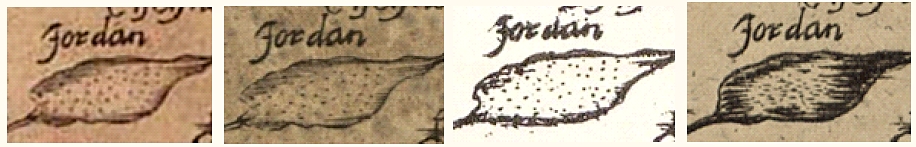
Fig. 2: Change in areal symbol intensity on the Aretin map (1st, 2nd, 3rd and 4th editions).
Source: National Archives of the Czech Republic, Map Collection of the Faculty of Science, Charles University.
The watercourse labels are on all editions of Aretin's map of Bohemia in German, Czech, and Latin languages. For example, the Labe river in Latin is Albis or Labe in Czech. The watercourse labels are handwritten (serif, italic font) with calligraphic tendencies; see Tab. 2. Behind the river names, the suffix "fl" or "flu" has been added, identifying the abbreviation from the Latin word "fluvius".
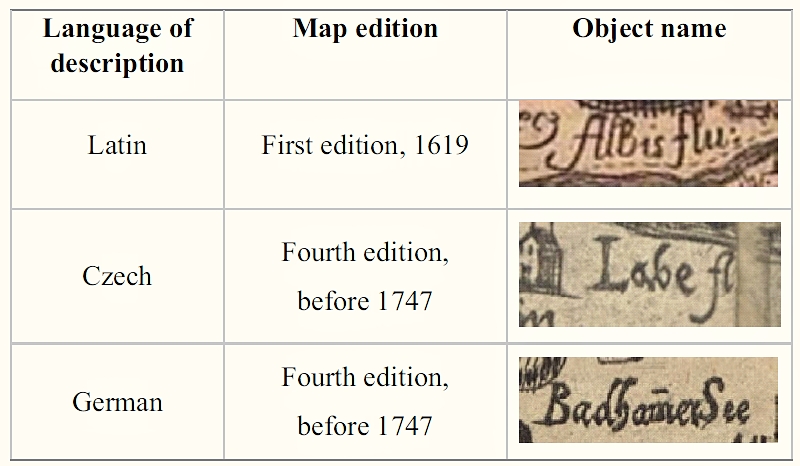
Tab. 2: Descriptions of watercourses on Aretin's maps of Bohemia.
Source: National Archives of the Czech Republic, Map Collection of the Faculty of Science, Charles University.
Bridges on Aretin's map
All four editions of Aretin's map of Bohemia show the same amount of bridges, eight in total. The bridges are depicted over the Vltava river in Prague, Labe river in Mělník, Roudnice n. Labem and Litoměřice and over the Ohře river in Libochovice, Louny, Žatec and Drahonice. The bridges are drawn simply, using two thicker unfilled lines, either closed at the end, forming a rectangle, or open and stretching across the hatched river; see Fig. 3.

Fig. 3: Examples of bridges in Louny, Libochovice and Roudnice on Aretin's map (1st edition). Source: National Archives of the Czech Republic.
Content analysis
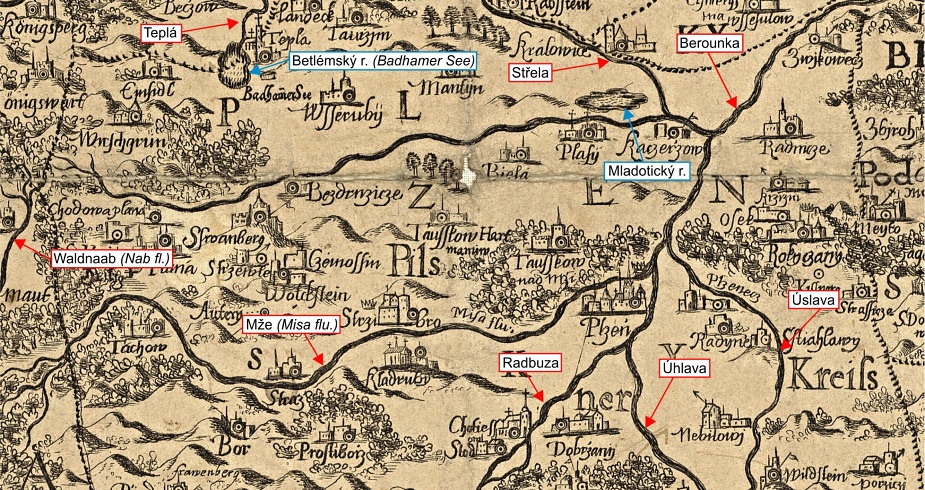
The location and identification of all rivers and water areas depicted on four editions of Aretin's map, as well as the geometric and topographic accuracy with respect to the present, were analyzed. An example of watercourse identification is shown in Figures 4 and 5.
 |
 |
|
|
Fig. 4: Watercourses around Pilsen on the 4th edition of Aretin's map. |
Fig. 5: Identification of German watercourses on the 4th edition of the Aretin map. Source: Map Collection of the Faculty of Science, Charles University. |
Watercourses on Aretin's map
In total, 121 watercourses on the four editions of Aretin's map of Bohemia were identified, of which 41 were described, and 17 water areas, including two described ponds (Bethlehem, Jordan) and two described springs (Labe, Morava).
Water areas on Aretin's map
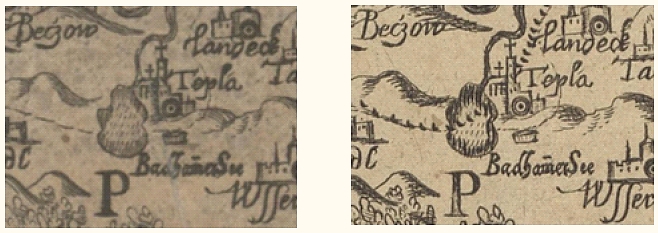
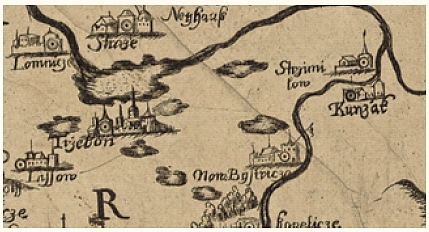
A total of 19 water areas are drawn on Aretin's map, while only two are described. The first is the Jordan pond, created in 1492. The second labeled water area is the Betlém pond, located on the Teplá river near the village of the same name; see Fig. 6. There are also eight unnamed water areas in the Třeboň region; see Fig. 7. The largest one could be the Rožmberk pond, according to its position to Lomnice nad Lužnicí (Lomnicze) and Třeboň as well as due to Lužnice river flowing through it.
 |
 |
|
|
Fig. 6: The Betlém pond on Aretin's map (2nd and 4th editions). |
Fig. 7: Water areas in the Třeboň region (4th edition of Aretin's map). |
Changes in topographic content
The most striking changes in topographic content in all four editions of the map are in the plotting of rivers in eastern Bohemia. The map of 1619 shows the Chrudimka flow, which rises in the Železné hory Mountains north of Ronov and runs parallel to the Elbe to Chrudim, where it turns north to Třebechov (Třebechovice), where it flows into the Orlice. On the 1632 edition, this entire course is removed from the map. Further changes are only in the edition by Kaspar Wussin. A tributary of the Loučná River was added to the river network and the Chrudimka River was redrawn; see Fig 8. There are also inaccuracies in the plotting of other rivers, such as the Kladská Nisa, Stěnava and Ohře.
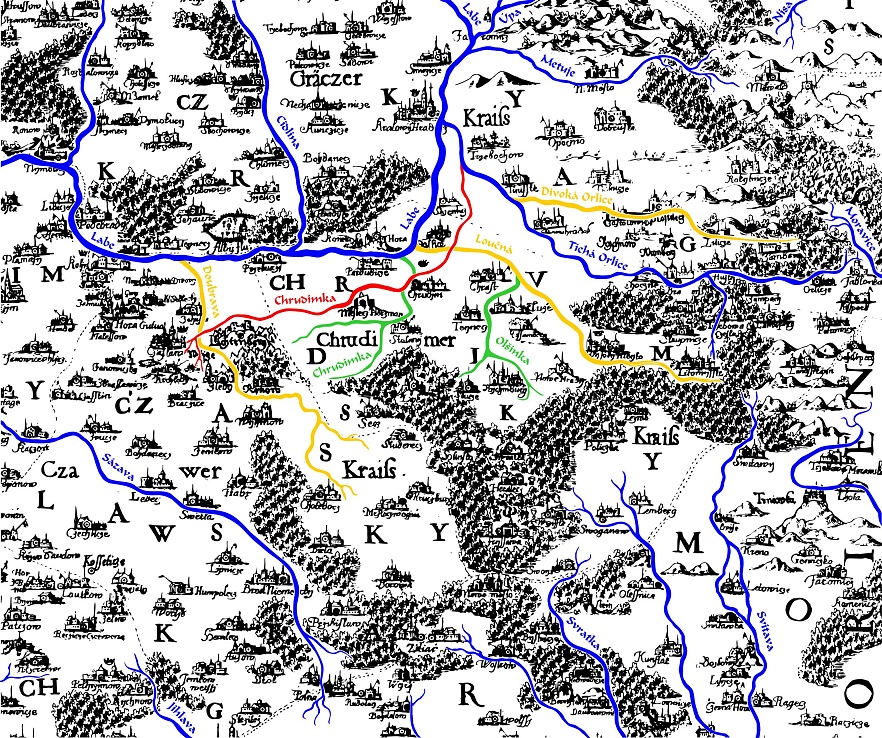
Fig. 8: Schematic representation of watercourses in East Bohemia. Rivers in blue are shown in all four editions without change. The Chrudimka river flow, depicted only in the first edition of Aretinova, is highlighted in red. The rivers added in the 1632 edition are in ochre. In the version by Kaspar Wussin, the Loučná tributary and the newly drawn Chrudimka (in green) are added to this network. Sourse: Map Collection of the Faculty of Science, Charles University.
Cartometric analysis of watercourses on Aretin's map
Cartometric analyses of the first edition of Aretin's map of Bohemia provided in TIFF format with a resolution of 400 DPI, were performed in the MapAnalyst software. Georeferencing was performed using the affine transformation, which is non-conformal but removes the map sheet distortions efficiently. In total, 70 identical points evenly covering the whole map area, respecting the historical and social development of the territory, were collected. The analyses provided the following results. Scale: 1:544,000; rotation by 9° to the east, standard deviation on the identical points is ± 5,322 m, and the average positional error is ± 7,526 m. Based on the calculation of displacement vectors, the least accurately drawn towns are Jihlava (18 km), Bad Kötzing (15.0 km), Dobruška (14.3 km), Domažlice (13.7 km) and Polná (13.0 km). Fig. 9 shows a deformation grid illustrating the local geometric distortions of the Aretin's map.
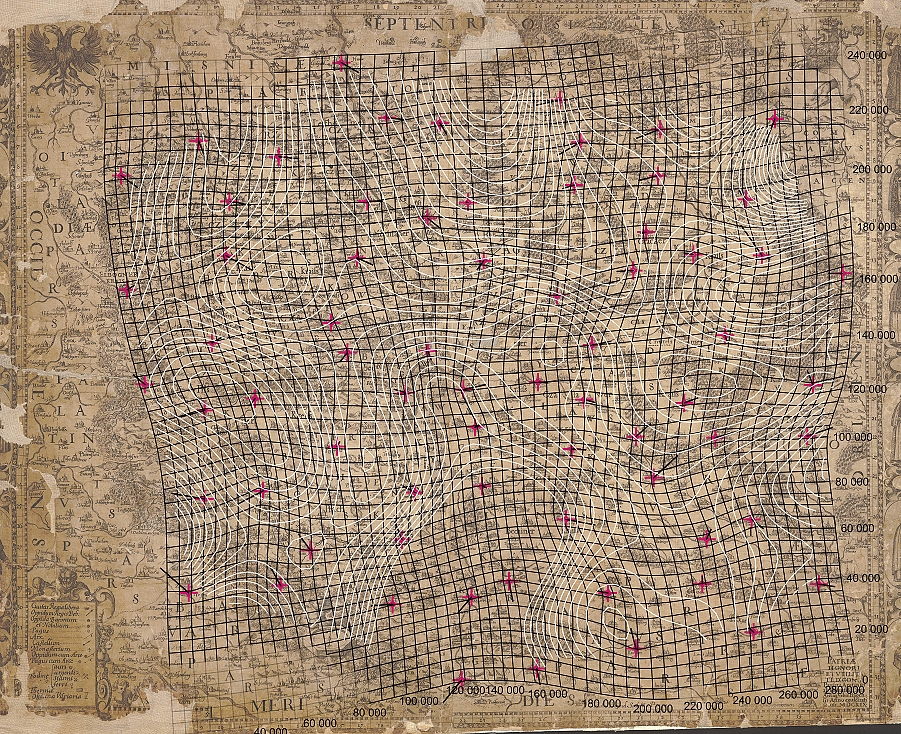
Fig. 9: Deformation grid with identical points and their displacement vectors on the Aretin's map. Source: National Archives of the Czech Republic.