

Mathematical Cartography
The research activities are focused on the following topics:
- automated estimation of the map projection and its parameters,
- finding inverse forms of map projections.
1. Automated identification of map projection and its parameters
doc. Ing. Tomáš Bayer, Ph.D.
The map projection analysis, together with the estimation of the best constant values of the projection, belongs to the new methods of the cartographic research of early maps. It represents a process of the recognition and reconstruction of the geometric relationship, between the early map content and the present representation of the Earth.
Source data are represented by identical points on the analyzed/current maps.

Key features:
- Determined parameters minimize norm of residuals.
- Graphical reconstruction of the graticule.
- Suppressing the impact of incorrectly drawn map elements on the results.
- Scale and rotation invariance.
Determined parameters (10):
- map projection (6):
Constant values of projection, affecting the graticule shape.
- analyzed map (4):
Map parameters, primarily scale and rotation.
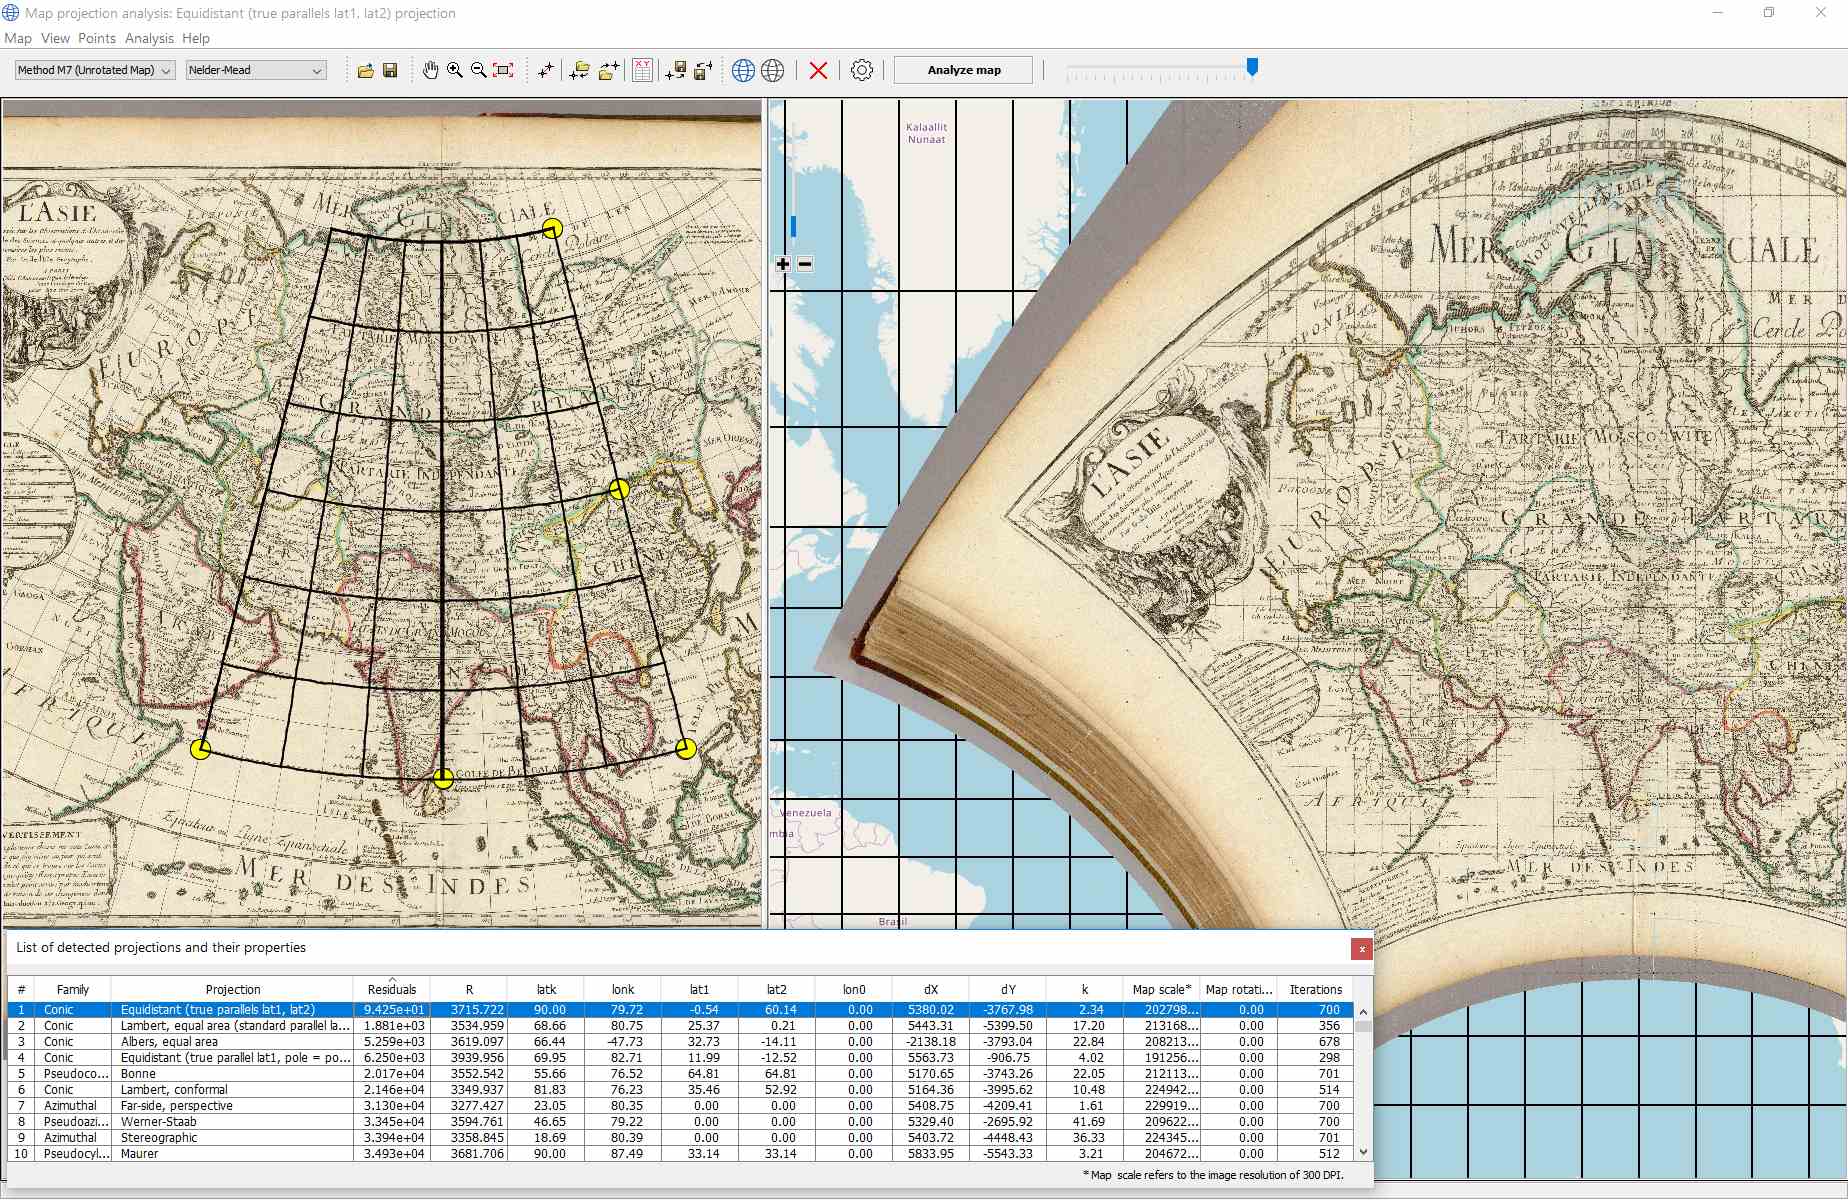
The determined parameters are used for the reconstruction of the map projection graticule. This task leads to the non-linear least squares problem solved by the hybrid BFGS method. For large residuals or ill-conditioned tasks, the hybrid methods combining the first-order (Gauss-Newton) and second-order (quasi-Newton) methods provide an efficient solution. The map projection analysis represents a “small problem”, the over-determined system leads to the singular Jacobian matrix . While the early maps provide large residuals, the current maps bring small (almost zero) residuals. For zero-residual problems the quadratic rate of convergence occurs, otherwise, the superlinear convergence is guaranteed.
The following picture illustrates the analysis of the map projection with the subsequent reconstruction of the graticule: the Nicolosi globular projection, Eastern Hemisphere).
SW detectproj
Written in Java, with a simple interface and a full graphical control over the analysis it allows an automated map projection analysis. Currently more than 100 map projections are supported.
Available free of charge from
http://web.natur.cuni.cz/bayertom/index.php/projection-analysis
References:
[1] BAYER, T. (2016): Advanced methods for the estimation of an unknown projection from a map. GeoInformatica, 20(2), pages 241–284, 2016. ISSN 1384-6175. Draft in PDF.
[2] BAYER T. (2014): Estimation of an unknown cartographic projection and its parameters from the map, GeoInformatica,Springer US, 2014, pages 1-49, IF 2.1. Draft in PDF.
[3] BAYER T.: Estimation of an Unknown Map Projection and its Parameters from the Map, 26th International Cartographic Conference, Dresden, Germany, 2013. PDF.
2. Finding inverse forms of map projections
doc. Ing. Tomáš Bayer, Ph.D.
Knowledge of the inverse form of projections is crucial in many applications, especially when reprojecting a map into different projections, processing heterogeneous data in GIS or cartometric analyses of early maps. The numerical approach to inverse brought several unwanted and disturbing artifacts or missing pixels, especially around the singular points of digitized maps. Block-based non-linear transformations with raster partitioning represent a slight improvement, but they bring problems with continuity along the boundaries of the blocks.
The projection of the set M=⟨-π/2,π/2⟩×⟨-π,π⟩ into R2 , given by the equations
x=f(φ,λ),y=g(φ,λ) ,
where f and g are real continuous functions defined on M , is called the map projection P of the sphere S2 into the plane σ . The inverse projection P-1 is given by equatiaons
φ=f-1(x,y), λ=g-1(x,y).
The derived partial differential equations of the inverse transformation have the form of
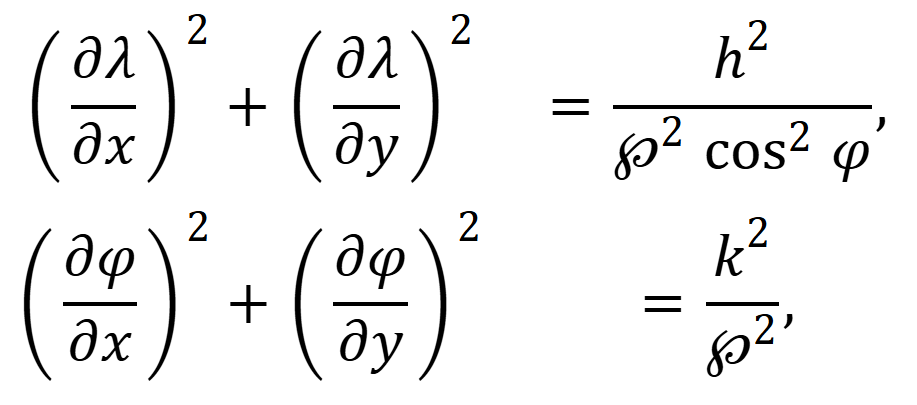
where h, k are the local linear scales
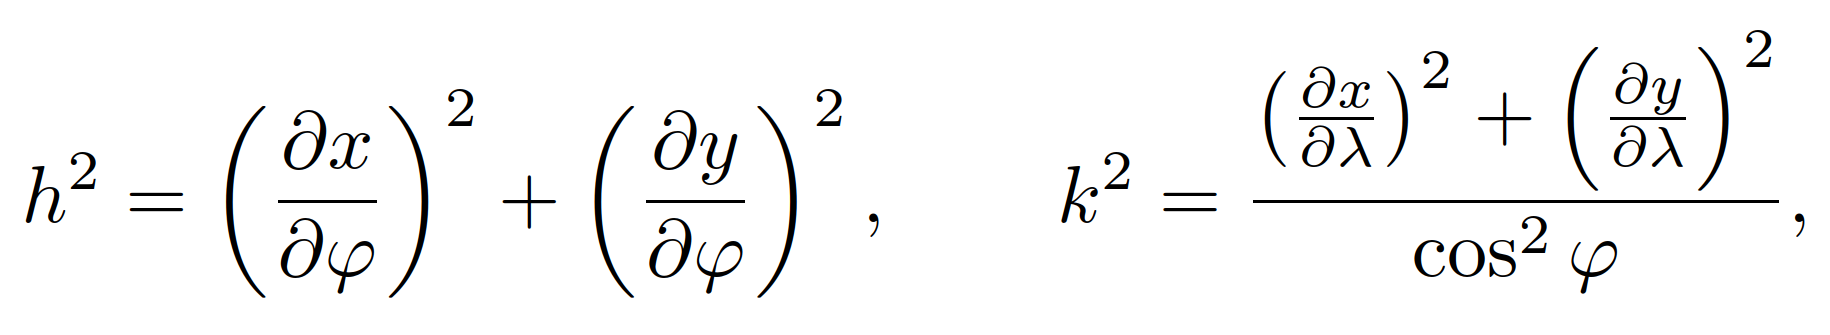
and
![]()
In general, for many projections, the closed form of their inverse form do not exist; the iterative solution is available.
3. Finding inverse forms of globular projections
doc. Ing. Tomáš Bayer, Ph.D.
3.1.Nicolosi projection
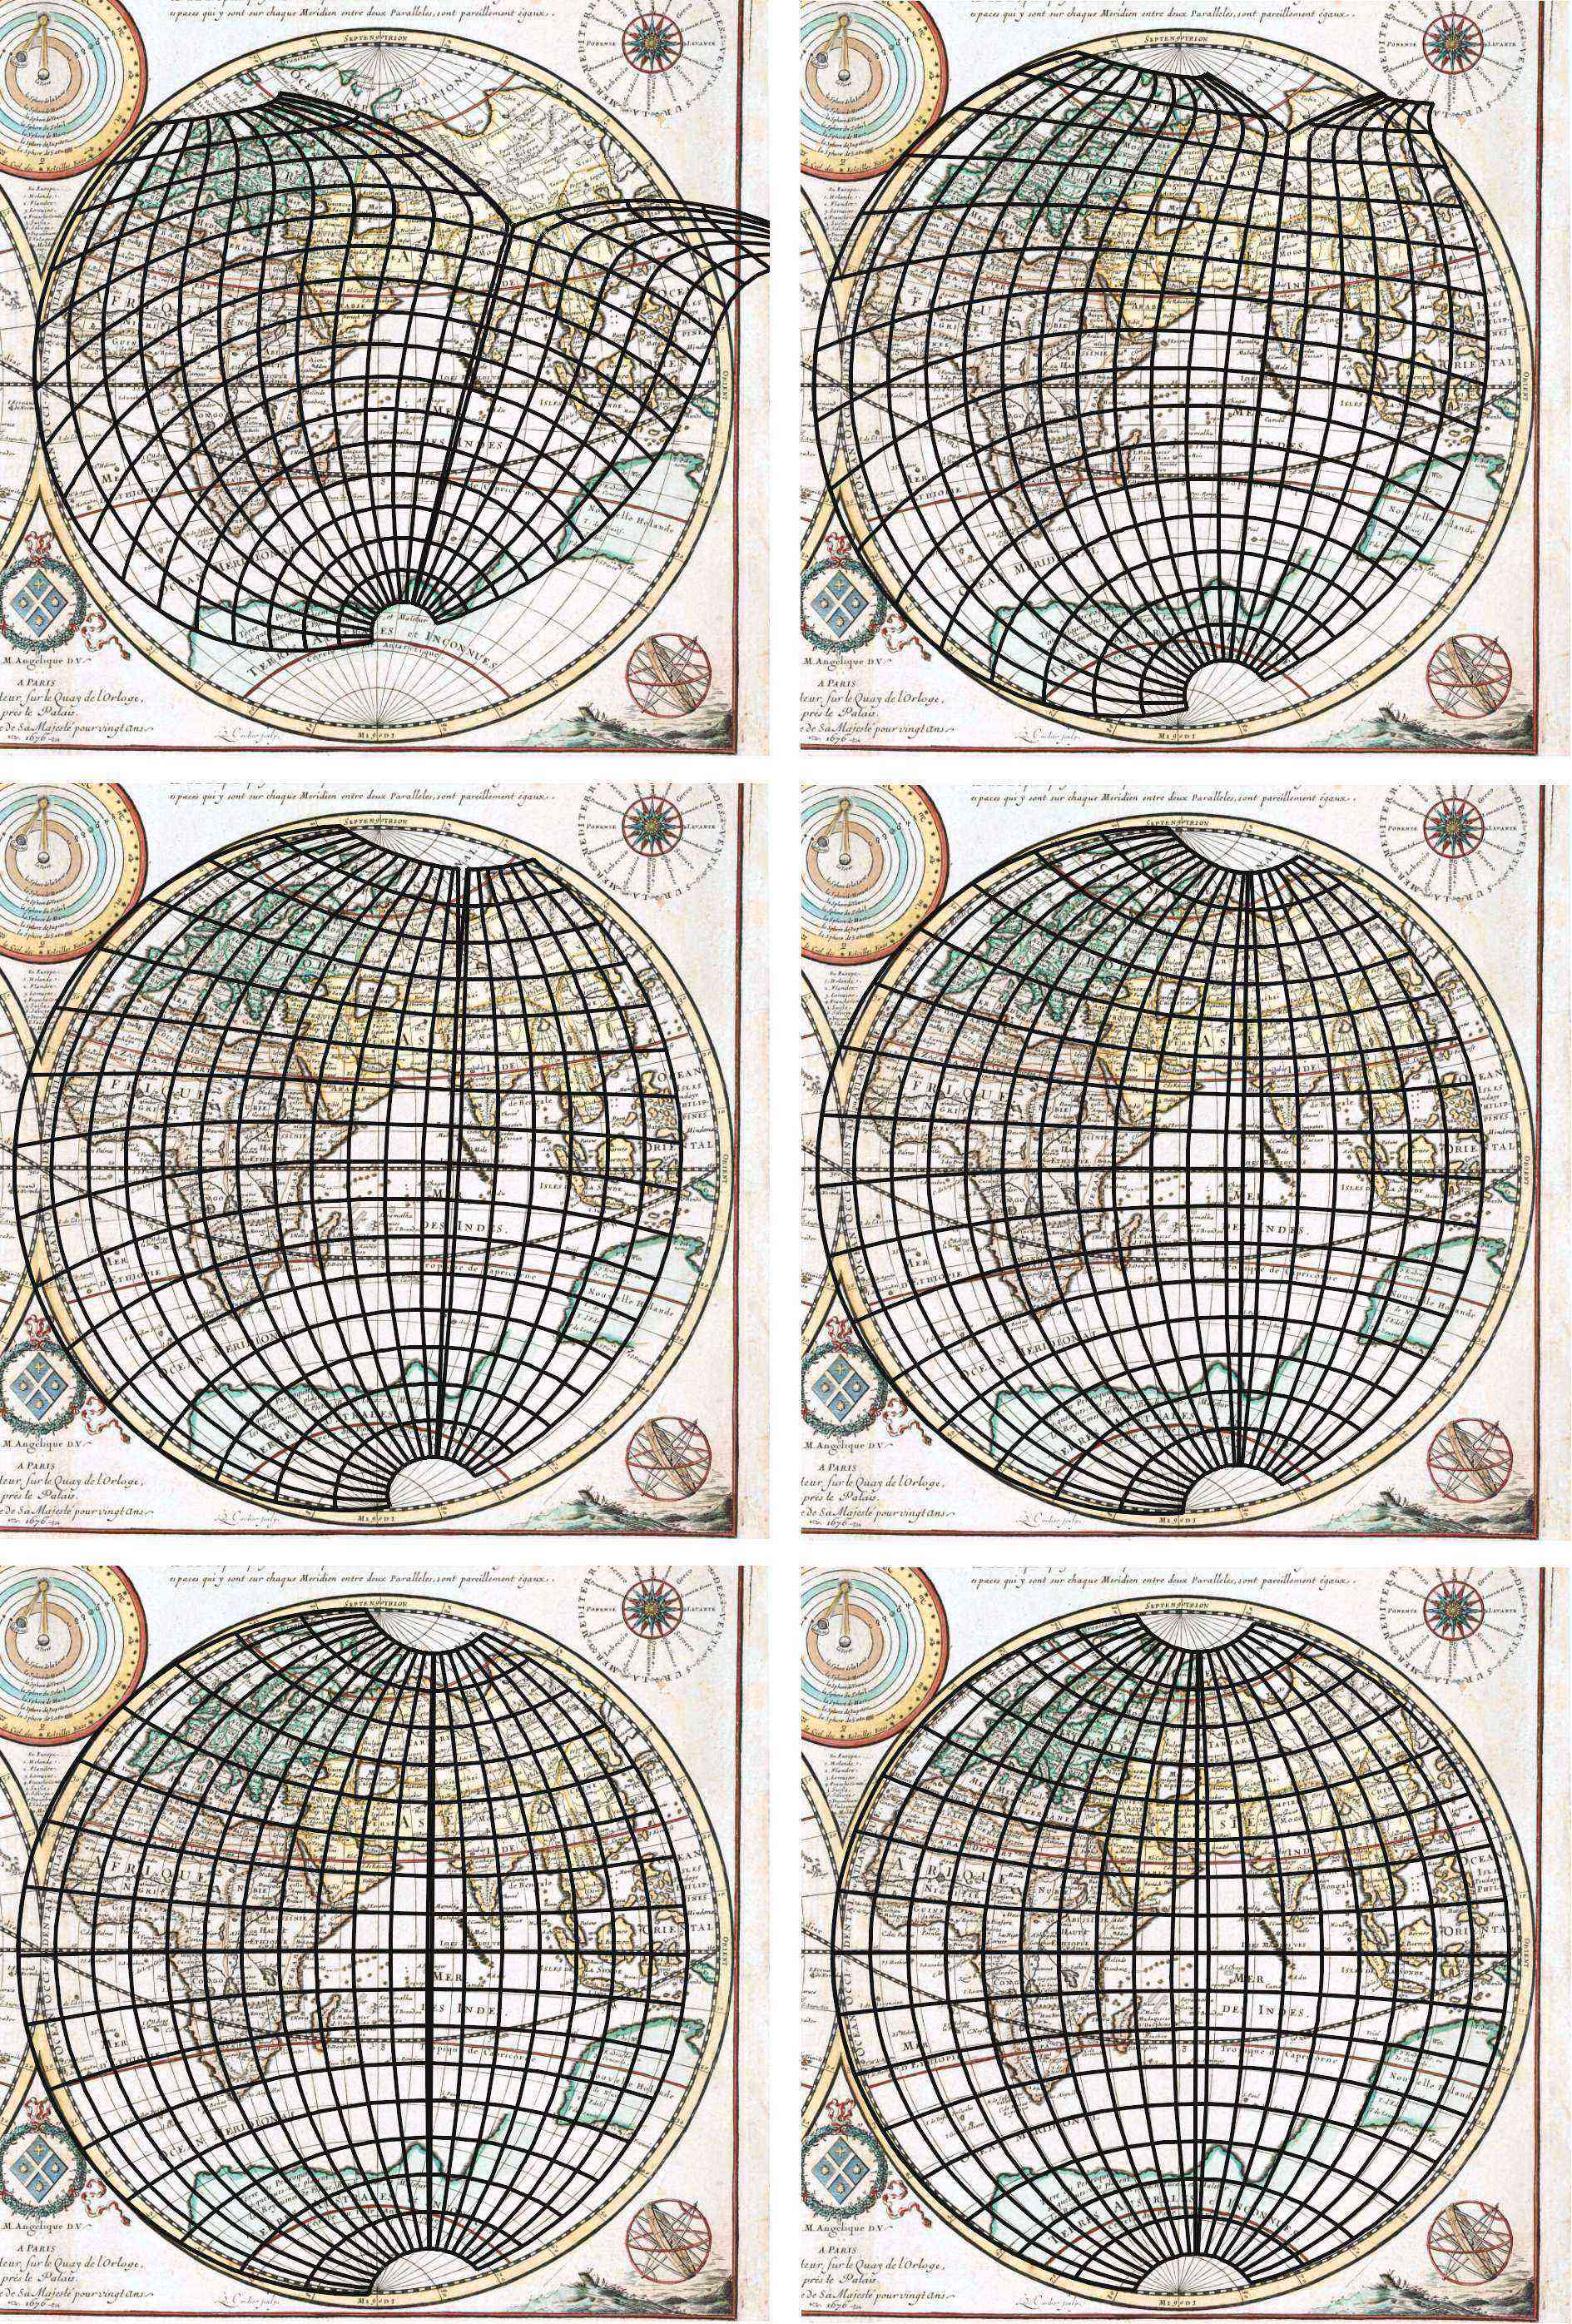
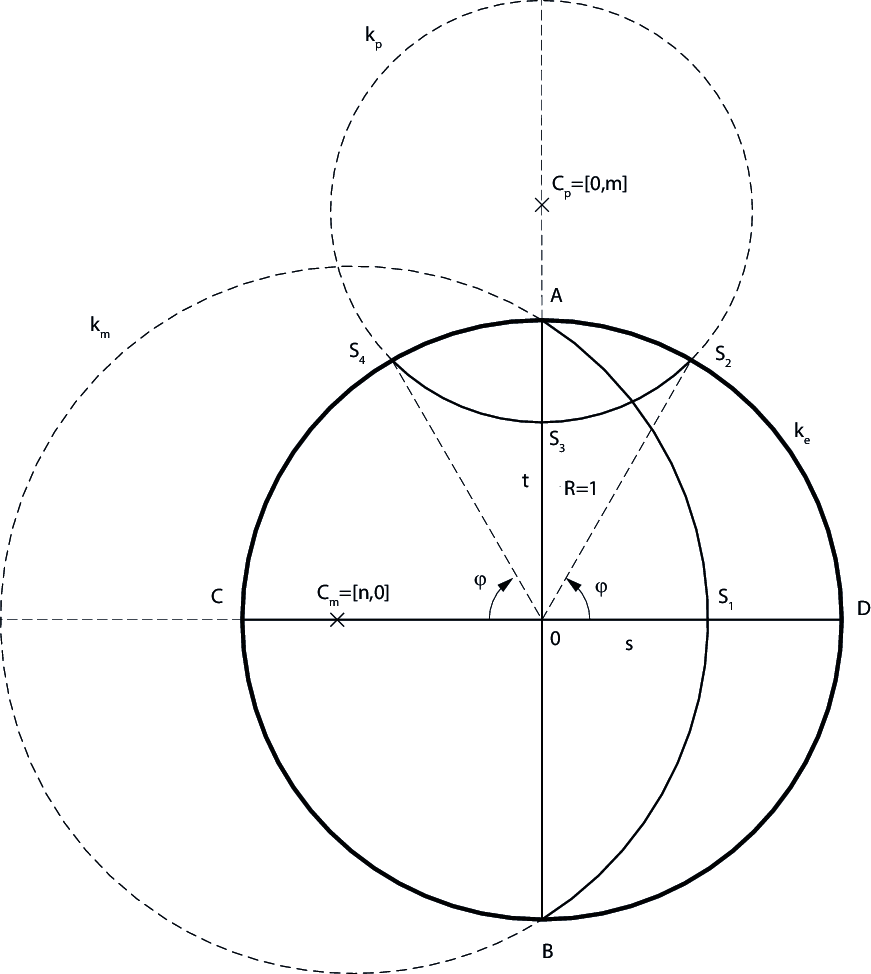
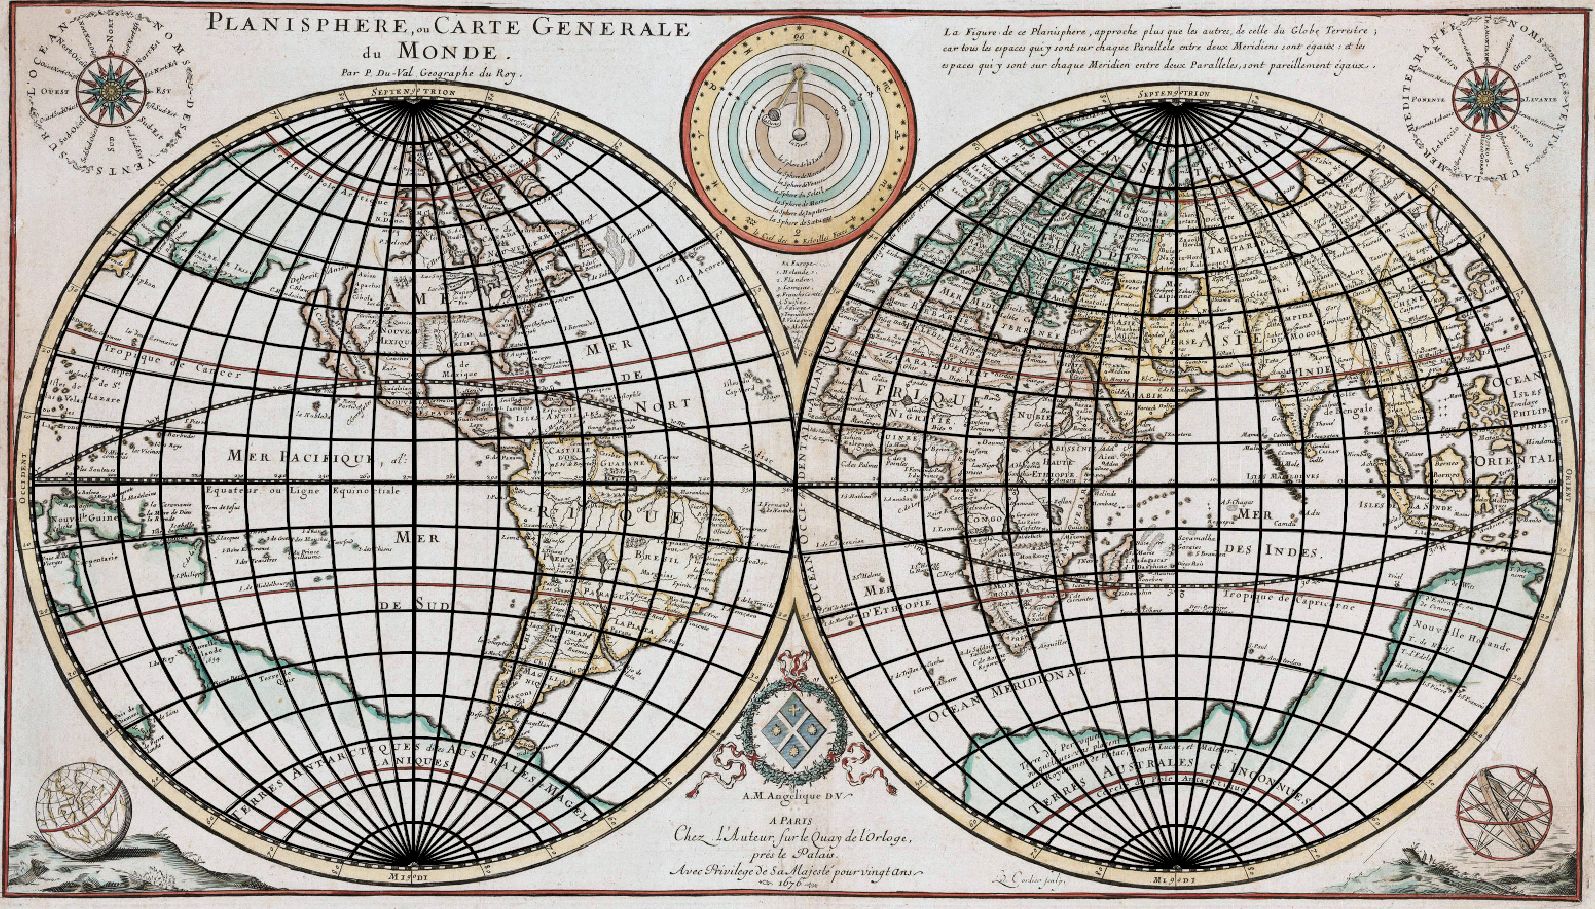
The Nicolosi globular projection discovered by the Persian geographer Abū Rayḥān Muhammad ibn Ahmad al-Bīrūnī (973-1048) was reinvented by the Italian geographer Giovanni Battista Nicolosi (1610-1676). Since the hemisphere was represented by a circle, the meridian/parallel are the circular arcs centered at the central meridian/equator, the projection was simple to construct and easy to use. The hemisphere projects as the circle. The image of the prime meridian (involving the North and South Poles) is the circle diameter, the perpendicular diameter is represented by the equator. The remaining meridians and parallels are circular arcs.
The map “Planisphere, ou Carte Generale du Monde” assigned to the French geographer Duval (1619-1683), see Fig. , was created in 1676. His uncle, the famous cartographer Nicolas Sanson (1600-1667), is well-known as the inventor of several map projections (Samson’s pseudocylindrical). This world map in two hemispheres uses the Nicolosi projection in the normal aspect with the shifted central meridian. Due to graphical inaccuracies of the map frame, the graticule, as well as the lack of solid geometric and geodesic bases, some discrepancies of the determined parameters are expected.
New derivation of the projection equations, which si more numerically stable, leads to the system of quadratic equations. The inverse form leads the transcendental equation for φ, which is solved using the Newton-Raphson method. The solution has a fast convergence, 5 iterations are sufficient.
3.2 Van der Grinten projections
The van der Grinten projections (I-IV) called globular (evoking a spherical globe), belong to the important map projections widely used in cartography. Providing a conventional image of the Earth, in which the hemisphere or planisphere is depicted as a circle and the meridian or parallel images are circular arcs, they are mainly used in atlases or on wall maps. Grinten projections are popular especially in American cartography, they are frequently used for political maps. While they are designed to allow an easy construction of meridians and parallels by ruler and compass, finding the analytic form of the projection equations is relatively complicated. The inverse forms have been published for projections I and III, otherwise, only the numerical solution exists (Newton-Raphson method). Unfortunately, the iterative methods do not provide good results around singular points, where a convergence may be lost.

Providing a conventional image of the Earth, in which the hemisphere or planisphere is depicted as a circle and the meridian or parallel images are circular arcs, they are mainly used in atlases or on wall maps. While they are designed to allow an easy construction of meridians and parallels by ruler and compass, finding the analytic form of the projection equations is relatively complicated. The inverse forms have been published for projections I and III, otherwise, only the numerical solution exists (Newton-Raphson method). Unfortunately, the iterative methods do not provide good results around singular points, where a convergence may be lost.
The derivation of formulas is relavitely complicated; see the references. The inverse reprojection of the map created in van der Grinten projection I into the Mercator projection (EPSG code 3857) popular in many web map servers, using the above-mentioned formulas illustrates the following depiction.

Refereces:
[1] BAYER, T., KOČANDRLOVÁ: On inversions of van der Grinten projections, Applications of Mathematics, Vol. 66, pp. 887-927, 2021, IF 0.897.
[2] BAYER, T., KOČANDRLOVÁ, M.: Reconstruction of Map Projection, its Inverse and Re-Projection, Applications of Mathematics, Vol. 63, pp. 455-481, 2018, IF 0.897.